


Introduction to Zabbix:
Zabbix is an open-source monitoring tool that tracks the performance and availability of network devices, servers, applications, and other IT assets. It provides real-time data monitoring, alerting, and visualization to assist organizations in ensuring the optimal performance and health of their IT infrastructure.
What it can monitor ?
Zabbix can monitor a large number of components, including:
Server resources: include CPU usage, memory, disk space, network interfaces, etc.Network Devices: Bandwidth usage, latency, packet loss, etc.Applications:Databases, web servers, mail servers, and custom applications, etc.Services:DNS, DHCP, FTP, Telnet, Ping and HTTP. etc.Virtualization Platforms: VMware, Hyper-V, and others.Cloud services:Amazon Web Services, Azure, and Google Cloud.Environmental Factors:Temperature, humidity, and other environmental variables.
Similar Tools
SolarWinds:
Strengths: SolarWinds provides a suite of monitoring and management tools, including network, server, and application monitoring. It has a user-friendly interface and offers a broad range of features.
Weaknesses: SolarWinds is a commercial solution with associated costs. It may be more suitable for enterprises with larger budgets.
Nagios:
Strengths: Nagios is a popular open-source monitoring system known for its extensibility and flexibility. It has a large community and supports a wide range of plugins.
Weaknesses: Setting up Nagios can be more complex compared to some other solutions. The web interface may also be considered less user-friendly.
Grafana:
Strengths: Grafana is primarily a visualization and dashboarding tool that integrates with various data sources, including Zabbix, Prometheus, and others. It is highly customizable and user-friendly.
Weaknesses: Grafana is not a full-fledged monitoring solution on its own; it relies on data from other sources
Datadog:
Strengths: Datadog is a cloud-based monitoring and analytics platform that provides full-stack observability. It supports infrastructure monitoring, application performance monitoring (APM), and log management.
Weaknesses: Datadog is a commercial solution with pricing based on usage, and costs can increase as the monitored infrastructure scales.
Why Zabbix Stands out?
Due to its robust feature set, scalability, and ease of use. It provides a comprehensive solution for monitoring diverse IT environments, and its flexibility allows for customization to meet specific needs.
Supports Many Integration with other Tools like Grafana, Prometheus, ServiceNow, Jira, . etc.
Zabbix architecture
Zabbix Elements
Zabbix Server
This is the heart of the Zabbix software. The Server can perform simple service checks on networked services (such as web servers and mail servers), but it is also the central component to which the Agents will report availability and integrity information and statistics. The Server is the central repository for all configuration, statistical, and operational data, and it is the entity in the Zabbix software that actively alerts administrators when a problem occurs in any of the monitored systems.
Zabbix proxy
Zabbix proxy used to get the metrics from clients in behalf of Zabbix server. its most used for Remote locations and access restricted network zones.
Zabbix Proxies can also be used to distribute load of a single Zabbix Server. In this case, only Proxies collect data this making processing on the Server less CPU and disk I/O hungry.
Proxy get the all the metrics and saved into Databases, and send the data to Zabbix server for centralized monitoring.
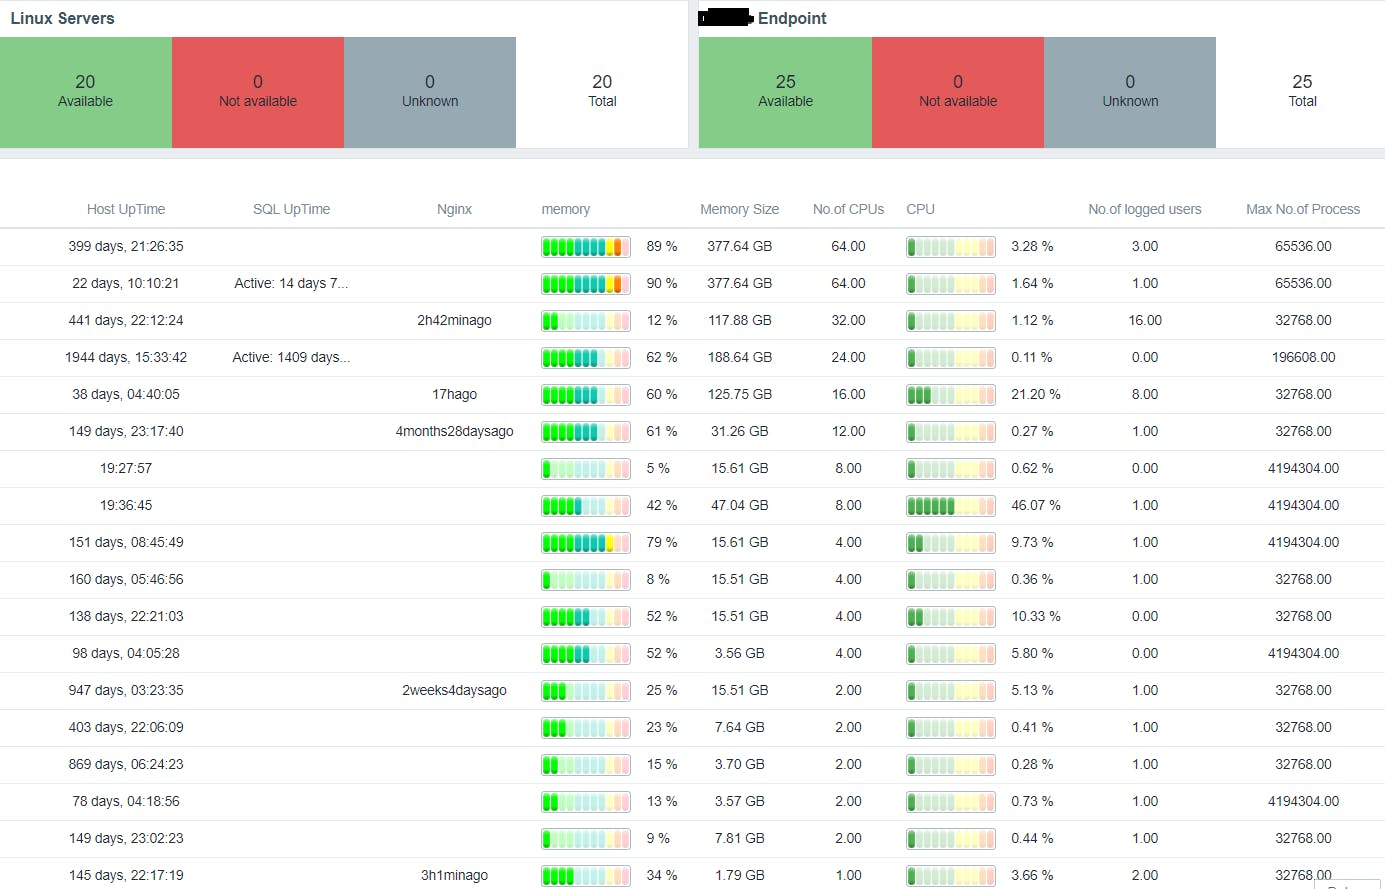
Dashboard
Allow to Group the multiple items and metrics in Same type of devices on dashboard.
we can create multiple Dashboards and its also includes Maps, Graphs, screens.
Visualize the data collected by Zabbix , show the data in Multiple formats like Graph , Pie chart, Analog, Log Format, Text. etc.
Server Status:
Website Status:
Screens
Its like a Slide show. Move the pages in Dashboard automatically and refresh the values in specified period.
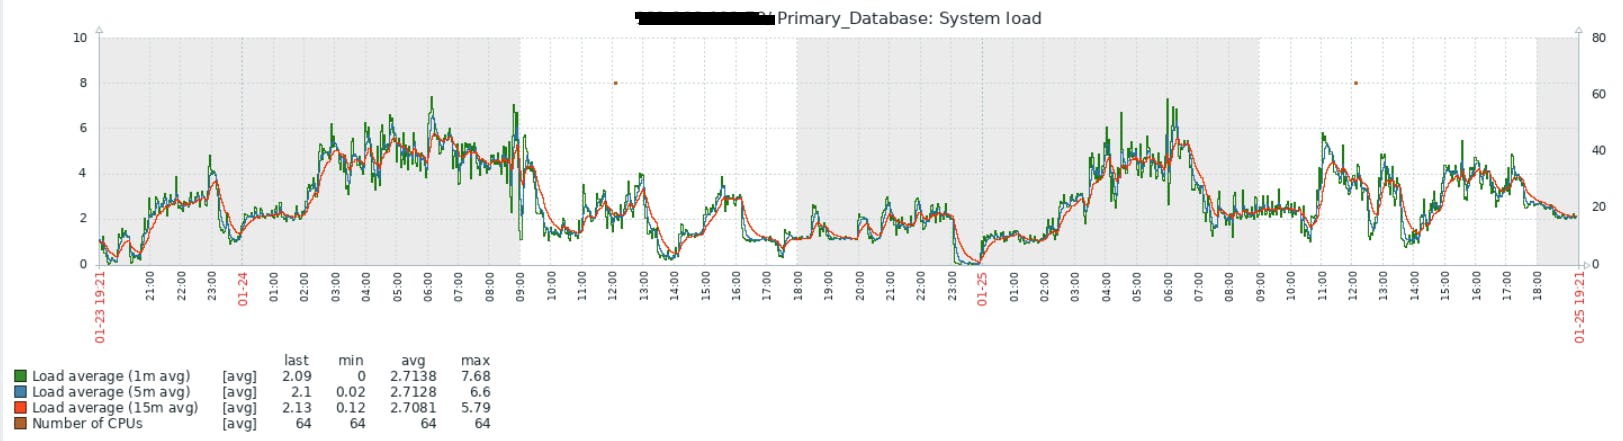
Graph
Metrics data convert into time series values and added in X and Y values, for specific time period.
Zabbix Agent
Needs to be installed on clients. it collect metrics like CPU, Memory, Disk, Network and more.
Communication between the Zabbix server and the Zabbix agent is typically done using the Zabbix protocol
Zabbix Agent2
Zabbix Agent 2 supports multiple protocols for communication, including gRPC, HTTP/HTTPS, and MQTT.
Zabbix Agent 2 is aimed at providing better performance and scalability, written in go lang.
Store data
Zabbix support multiple Databases PostgreSQL, SQLite, and Oracle. Using Database zabbix store the all the collected metrics, Components, Templates, items, host, and all the zabbix web components.
Host
Network connected devices are configured in hosts. it can be Servers, Network Switches, Firewalls, Websites, Databases, etc.
Hostname: The name or network address used to identify the host. This can be an IP address, DNS name, or any other identifier.
Visible Name: A user-friendly name for the host, which is used in the Zabbix user interface.
Groups: Hosts can be organized into groups to simplify management and configuration. Groups are useful for categorizing hosts based on their functions or locations.
Templates: Hosts can be associated with templates, which are predefined sets of items, triggers, and other monitoring configurations. Templates help in standardizing monitoring across multiple hosts.
Interfaces: Specifies how Zabbix should connect to the host. This includes the type of connection (agent, SNMP, JMX, etc.) and the necessary connection details.
Item
Type: Determines the kind of data that the item will collect (e.g., numeric, character, log, etc.).
Key: A unique identifier for the item on the host. It specifies how Zabbix will retrieve data from the monitored device.
Data Type: Defines the format of the collected data (e.g., float, integer, character).
Update Interval: Specifies how often Zabbix should collect data for this item.
History Storage Period: Defines how long historical data for the item should be retained in the database.
Trigger
Trigger configured from items. If the item value has changed to specific pattern in particular time trigger will indicate to zabbix.
Expression: The core of a trigger is its expression, which defines the condition that, when satisfied, triggers an alert. The expression typically involves comparing the current value of an item with a defined threshold or pattern.
Severity: Triggers are assigned a severity level, indicating the importance or seriousness of the triggered event. The severity level helps prioritize and classify events based on their impact.
Dependencies: Triggers can be dependent on other triggers. Dependencies help avoid flooding the system with alerts when the root cause of a problem is known and already being addressed.
Recovery Expression: Specifies the condition under which a trigger is considered to have recovered. When the recovery condition is met, Zabbix generates a recovery event, indicating that the issue has been resolved.
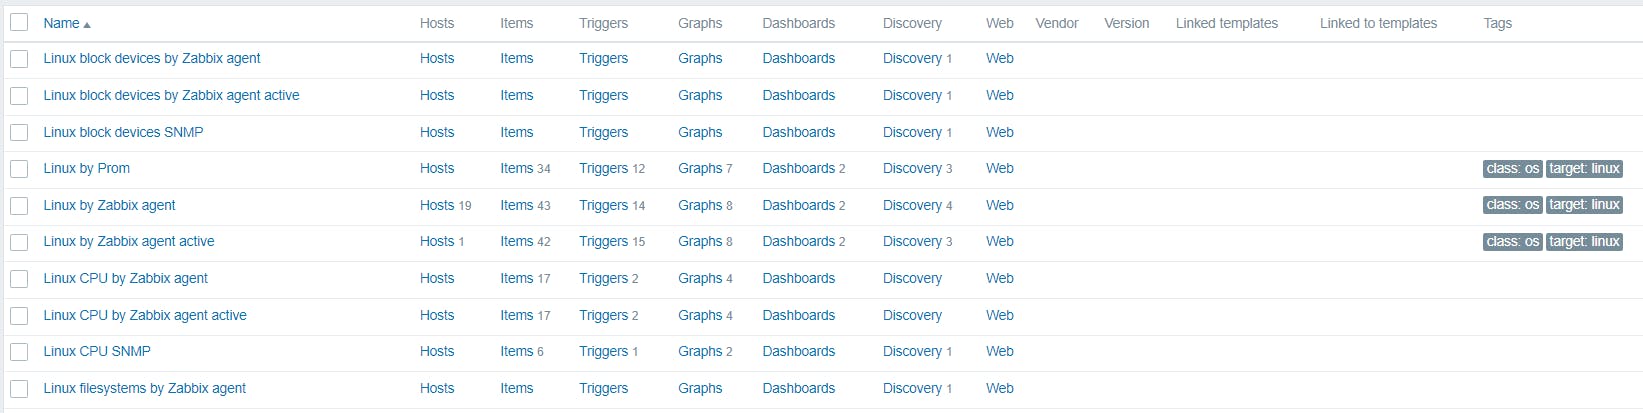
Template
Pre-defined functions for monitor the end devices. Its includes items, Triggers, Graphs, web configurations, Discovery rules, Application, linked Templates.
Ex: Linux Templates in zabbix
Media Types
All the Webhook, Email, Slack, etc, configuration saved in Media Types. Using media types alerts will send to users as per trigger Action configurations.
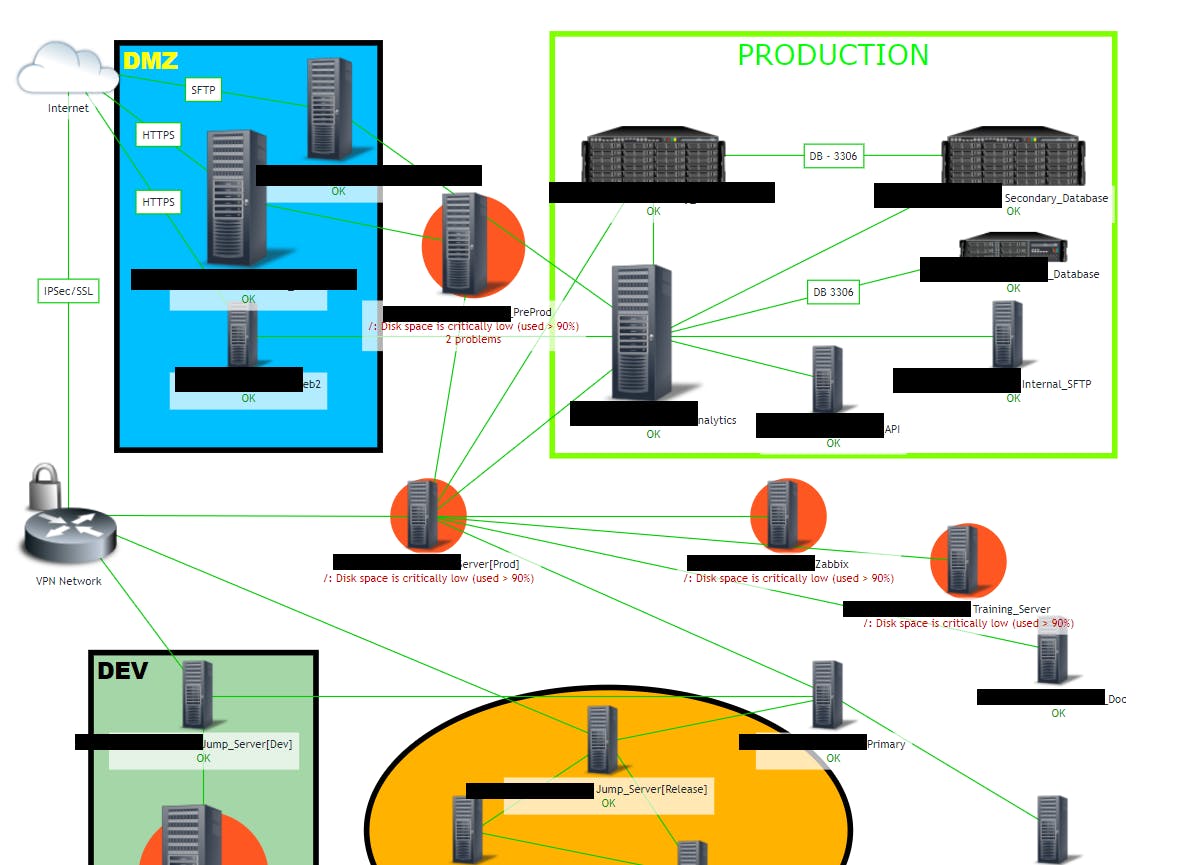
Maps
Identify the device how they interconnected with each others. we can create the Network Map by own, and create the connection flow for across devices. Through network able identify the device issues where the service failed by easy way.
Automated device management :
Inventory Management: Automated tools can maintain an up-to-date inventory of all devices in the network.
LLD - low level discovery
Using low level discover Zabbix discover the new hosts or items based on the discovery rules.
Example:
we have installed the Zabbix agent for 50 Linux servers, if we configure the all Hosts by manually we need huge time, To achieve this Zabbix can monitor the network and add the hosts based on conditions it will create a hosts in Zabbix server using discovery mechanism.
Case Study
Monitor VMware ESXI
3rd Party Templates: https://www.zabbix.com/integrations/vmware#3rd_party
We can monitor using VMWare ESXI by Zabbix Simple Check and SNMP
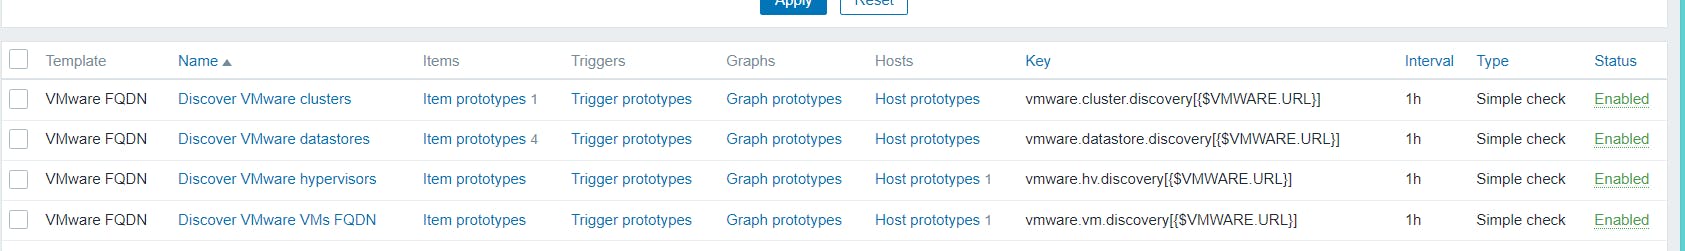
Using Simple Check we can connect over HTTP connections get the metrics by Zabbix discovery rules and create the VM hosts on Zabbix.
Example:
Change the zabbix server config /etc/zabbix/zabbix_server.conf StartVMwareCollectors=2
Choose Template - VMware FQDN
Set-Up Macros
{$VMWARE.URL} - VMware service (vCenter or ESXi hypervisor) SDK URL (https://servername/sdk)
{$VMWARE.USERNAME} - VMware service user name
{$VMWARE.PASSWORD} - VMware service {$VMWARE.USERNAME} user password
Monitor Fortigate Firewall
Using HTTP
Requirements
Zabbix version= 6.4 and higher.
Tested versions
This template has been tested on: = FortiGate v7.4.0
Using SNMP
3rd Party Templates: Fortinet monitoring and integration with Zabbix
About SNMP:
OID = Object identifier , Links to each metric, specific for Each device
MIB =
Location: /usr/share/snmp/mibs
Check the net-snmp.sourceforge.net
SNMPv1 - Old protocol, Not encrypted Transmission, not supported for 64 Char.
SNMPv2 - same as SNMPv1, But Support 64 bit chars, Mostly used
SNMPv3 - Supports Encrypted Connection, Authentication and configuration little complicated
Check SNMP Status:
snmpwalk -v2c -c<community_name> <ip> <OID>(1.3.6.1.2.1.1)
SNMP Trap
Install SNMP trap on zabbix server or proxy server then configure according to device to monitor
Example:
vim  /etc/snmp/snmptrapd.conf
#Add below lines
add authCommunity execute <community name>
log file /tmp/zabbix_traps.tmp # SNMP log file
perl do "script_zabbbix_trap_receiver.pl" # add the script file location
Download SNPM trap script form zabbix-github docs
Check SNMP status
snmptrap -v2c -c<commonutiny_name> <ip> '' <OID_of Device> "link down example v2c"
Monitor Fortigate Firewall
Using SNMP
Go to Forticlient Setupnew SNMP configuration
Create New SNMPv1/v2c
Add Community Name= fortinet (case-sensitive)
IP Address= <zabbix_Server_IP>
v1 Port= Enbale,Traps local port =162 , Remote Port =162
Enable SNMP Events and Save , APPLY.
Open the Network Interface for SNMP
Add network mask : <zabbix-ip>/netmask
Choose SNMP protocol from Administrative Access
Add Host in Zabbix
Download Template SNMP Fortinet devices v2019 download from Zabbix-github and import it.
Add SNMP IP ,Port and Choose SNMPv2 version
Add SNMP Community : < same_name_crrated_on_fortigate>
Monitor Cisco Switches
Example:
Get Cisco Check the SNMP OID for Cisco device
Template: Net Cisco IOS SNMPv2 ( choose based on cisco version)
Add SNMP <Community name>
Check SNMP Status:
snmpwalk -v2c -c<community_name> <ip> 1.3.6.1.2.1.1
SNMPv2-MIB:: sysDescr.0
SNMPv2-MIB::sysObjectID.0 OID::enterprises.9.1.324
Monitor items by SNMP:
CPU, Memory, Fan Status, Network Interface speed, Temperature
Monitor Windows PC using SNMP
Step 1: Enable SNMP on the Windows PC:
Install SNMP Feature:
- "Control Panel" > "Programs" > "Programs and Features." "Turn Windows features on or off."
Configure SNMP Community String:
- Configure the SNMP community string, which acts as a password for SNMP communication. Set a community string (e.g., "public" for read-only access).
Configure SNMP Traps (Optional):
- You can configure SNMP traps if you want to receive notifications for specific events. This step is optional and depends on your monitoring requirements.
Step 2: Configure SNMP Monitoring on Zabbix:
Add Windows Host to Zabbix:
Go to "Configuration" > "Hosts" and click on "Create Host."
Add necessary information, including the host name, IP address, and SNMP interface details.
Define SNMP Community String:
- In the host configuration, specify the SNMP community string that matches the one configured on the Windows PC.
Set Up SNMP Items:
Create SNMP items to monitor specific metrics on the Windows PC. Common SNMP items include:
SNMPv2:
snmp[<OID>](e.g.,snmp[sysUpTime]for system uptime).SNMPv2:
snmpwalk(to query multiple OIDs).
Step 3: Test SNMP Monitoring:
Check Connectivity & Verify SNMP Metrics
Monitor using HTTP/Ping/Curl/Telnet
Using Ping command we can monitor the connectivity of network devices and trigger alerts when ping request fails.
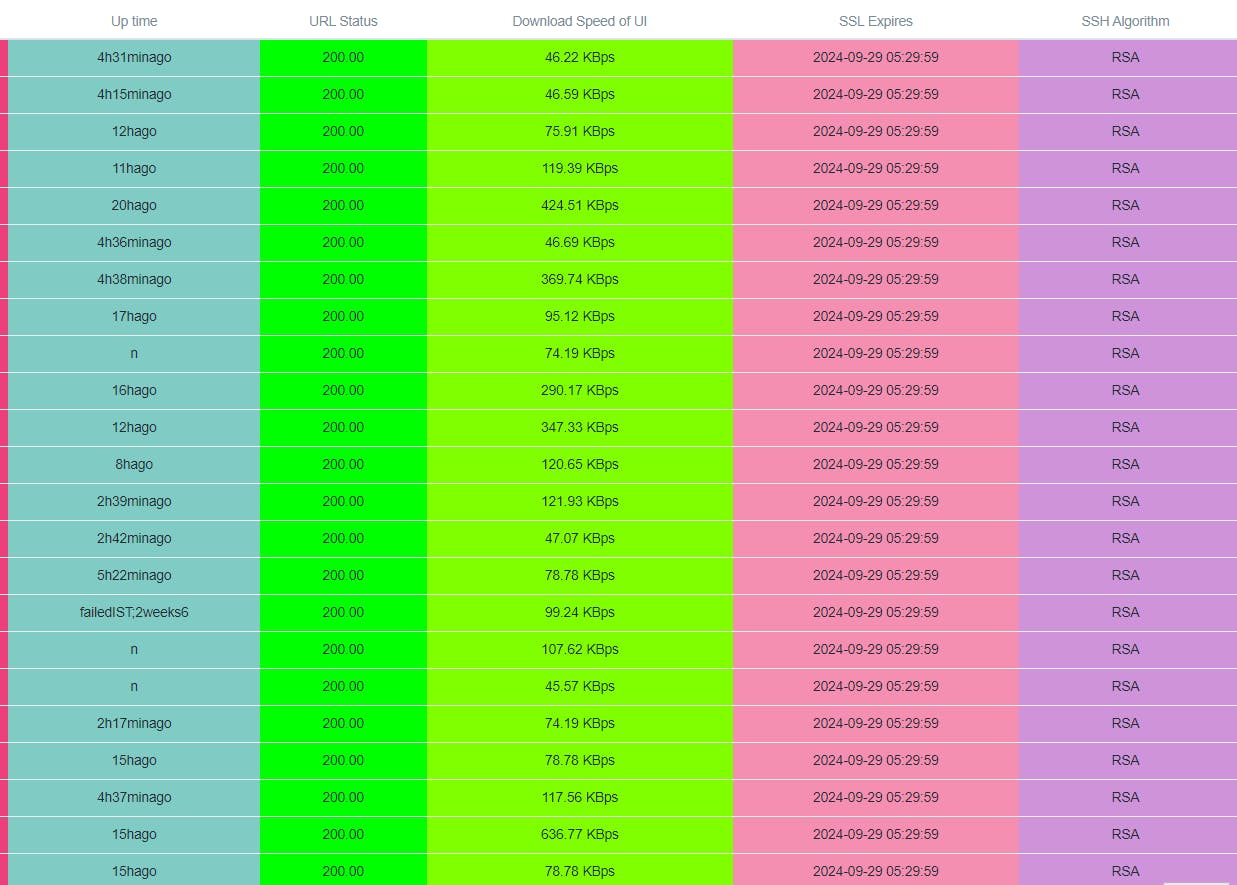
HTTP Request
Monitor the websites by sending HTTP request , get metrics about website status, SSL status, Connection Speed, Website data.
Cons:
Complex Setup for new users
User Interface (UI) Design
Resource Intensive
Documentation Challenges
Graphical Reporting Limitations
Learning Curve for Advanced Features
Community Support
Upgrade Process